Fiber Network Proximity Scoring in Data Center Site Selection
Fiber proximity matters less than route diversity, capacity, and latency in choosing where to build.

Fiber network proximity scoring gives teams a way to compare sites with different connectivity as part of data center site selection. Its value depends on scoring more than distance, setting weights for the intended workload, and confirming what the maps suggest. Even with strong fiber, a site still needs power it can use, and a high map score alone cannot show that two routes are independent.
What fiber proximity scoring actually measures and why it is treated as a factor, not a filter
Fiber proximity scoring ranks candidate sites by the quality of their access to fiber networks. It sits within a geographic information system, or GIS, using multi-criteria decision analysis, or MCDA, to combine several measures into a site score. The method separates constraints that eliminate land from factors that rank the land left over.
The underlying fiber data covers more than the location of a cable. PVcase identifies availability, capacity, ownership, latency, and physical proximity as necessary inputs. Each answers a different question about whether a connection is possible, what it can support, and who controls it. A map that shows nearby infrastructure answers only part of that inquiry.
Wherobots treats fiber as a scored factor based on distance to long-haul and metro routes and on route diversity. This lets connectivity be weighed against cost, latency to users, and land economics. A site with moderate fiber proximity can therefore outrank one closer to a route if its other advantages are strong enough. The MCDA distinction is precise, because a filter removes a site regardless of its merits, while a factor changes its standing among sites that remain.
The variables that go into a fiber proximity score include distance, route diversity, capacity, and latency
A useful fiber score keeps four variables distinct, namely physical distance, route diversity, available capacity, and latency. They do not necessarily improve together. A site can be close to a cable yet lack an independent second route or the capacity its workload needs.
Distance measures how far a candidate site is from high-capacity routes. A shorter gap generally lowers the cost and complexity of connecting the site. Long-haul and metro options also have different performance and cost profiles, so proximity alone does not make them interchangeable. Route diversity measures whether connections take paths that are physically independent of each other. Two providers sharing the same conduit do not supply that independence, however close their networks appear to the parcel.
Capacity concerns what the available network can support. Provider network maps help assess connection options and possible redundancy, while proximity to carrier hotels can widen those options beyond access to a cable alone. Latency then measures the performance constraint between the site and users or exchange points. Wherobots describes a rough estimate using straight-line distance, a factor of 2.1, and the speed of light in fiber. That estimate helps translate geography into a score, but it remains distinct from the capacity and route-diversity measures.
Why the weight assigned to fiber in a site score depends on what workload the facility will run
Fiber’s weight depends on the workload and has no default that fits the whole industry. Selecting that weight before defining the workload reverses the method, because the facility’s purpose determines which connections matter. An AI training campus and a latency-sensitive colocation facility can receive different evaluations of the same parcel without either evaluation being wrong. They are testing different requirements.
A hyperscale AI training campus places most weight on power and land. It can tolerate moderate latency because users do not interact directly with the training cluster. AI inference has less location freedom because latency to users and access to the clouds running the application matter. Enterprise production has further limits based on how far the site is from offices and users, how staff can reach it, and how the existing network is designed.
Interconnection-led colocation gives more weight to fiber, latency, and proximity to demand. Route diversity and access to internet exchange points, or IXPs, become almost necessary for a site to qualify and do more than change its score a little. An edge facility puts particular weight on latency and permitting, with response time to its serving population governing the connectivity assessment. Financial trading colocation is tighter still, because a single carrier route or no path to a Tier-1 IXP within the workload’s latency budget is effectively disqualifying. A fixed fiber weight across every RFP therefore either overvalues connectivity features for training campuses or undervalues them for facilities that depend on them.
Where fiber sits in the sequence of site filters — and why power comes before it
Weight sets how much fiber matters, while the order of diligence sets when its strengths can count toward choosing a site that works. The sequence of constraints is power, fiber, regulation, water, and land. Power comes first because no amount of connectivity can compensate for a site that cannot obtain firm capacity by the target date. Wherobots makes power capacity and interconnection the first hard filter.
With longer power interconnection queues, this filter rules out more sites than it did before 2020. Fiber then operates on a shorter list of genuinely power-viable sites. Long-haul routes and middle-mile builds have expanded enough that most such sites can be connected at a price. Assessing whether the available paths provide the independence and latency the workload requires is often harder than establishing whether a cable exists nearby.
Scoring every layer together does not remove the need for this sequence. A composite score can otherwise advance a site that looks attractive on paper but cannot attract financing because it fails power. Once power passes, workload-specific fiber thresholds can still disqualify a parcel before softer connectivity advantages affect its ranking. A single route or an inadequate path to a Tier-1 IXP cannot be offset by a good distance score where the workload requires better. Flexential identifies diverse fiber routes and redundant network paths as foundational infrastructure, which makes redundancy a structural requirement.
How GIS layers make fiber proximity comparable to power, land, and permitting in a single spatial query
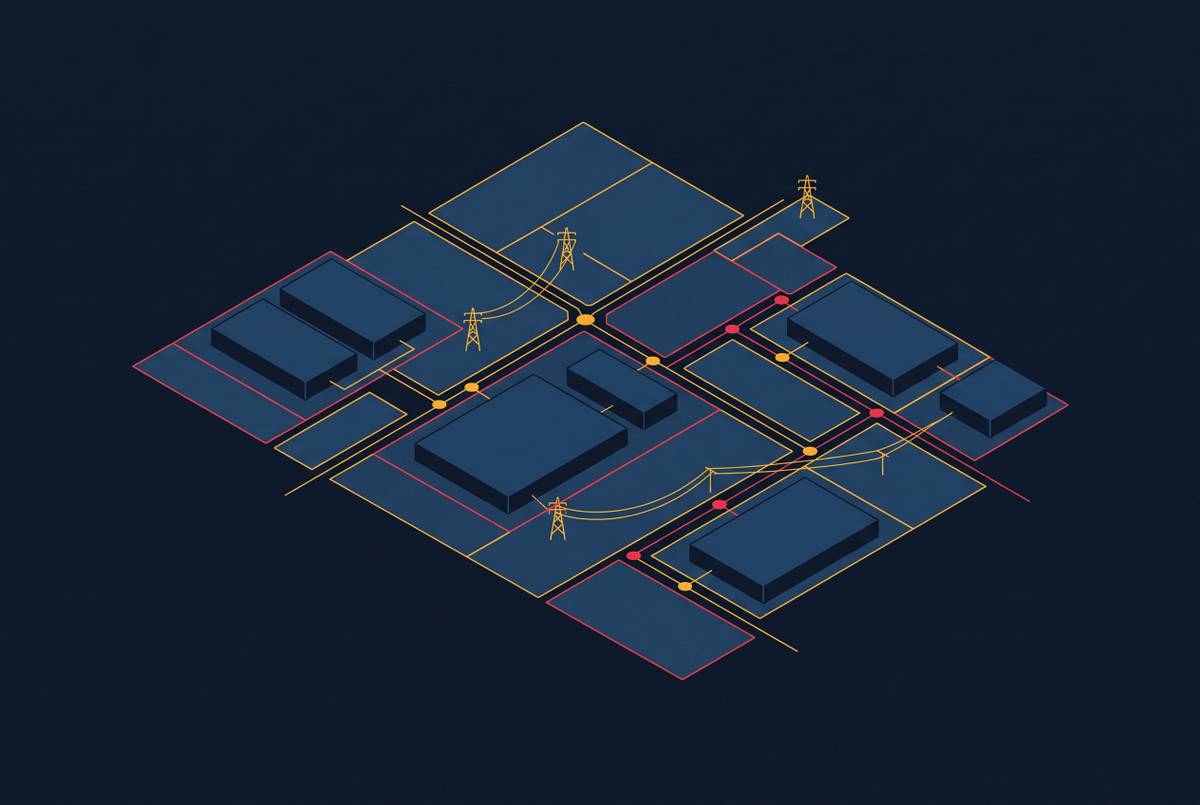
GIS makes these comparisons practical by representing each criterion as a data layer with a geometry and an attribute. Fiber routes, transmission lines, hazard zones, and zoning can then be evaluated against the same candidate land. MCDA first rules out sites that fail the constraints, then combines the scored factors to rank parcels, saving the team from reconciling separate maps by eye.
Wherobots illustrates the method in eastern Loudoun County, Virginia, with a screen run as one SQL query in 13.9 seconds. The query scores fiber as a spatial layer with transmission, hazards, and zoning, and a handful of cells receive full marks across all layers. Its parcel-level West Texas example shows why the weighting step matters just as much as the query. Two weightings of the same criteria share only a small fraction of their top parcels.
The fiber layer also needs a clear account of what it represents. Commercial fiber maps are not always available, so open-data screens sometimes use highway and rail corridors as rough proxies. Those corridors show where routes might run but leave fiber access unconfirmed. Keeping that distinction visible makes the layer’s contribution auditable and adjustable without rebuilding the entire screen. PVcase takes the same approach by stressing the need to combine geospatial analysis, infrastructure data, and real-time insights for the full picture.
The data quality problems that weaken fiber proximity scores in practice
A GIS score is only as precise as its inputs, which makes staged diligence necessary. Commercial fiber maps can lag new builds or give a misleading picture of route independence. A parcel can consequently score well even when its actual connection options are weaker than the screen suggests. The spatial model narrows the search, while carrier-level diligence establishes whether the apparent advantages hold.
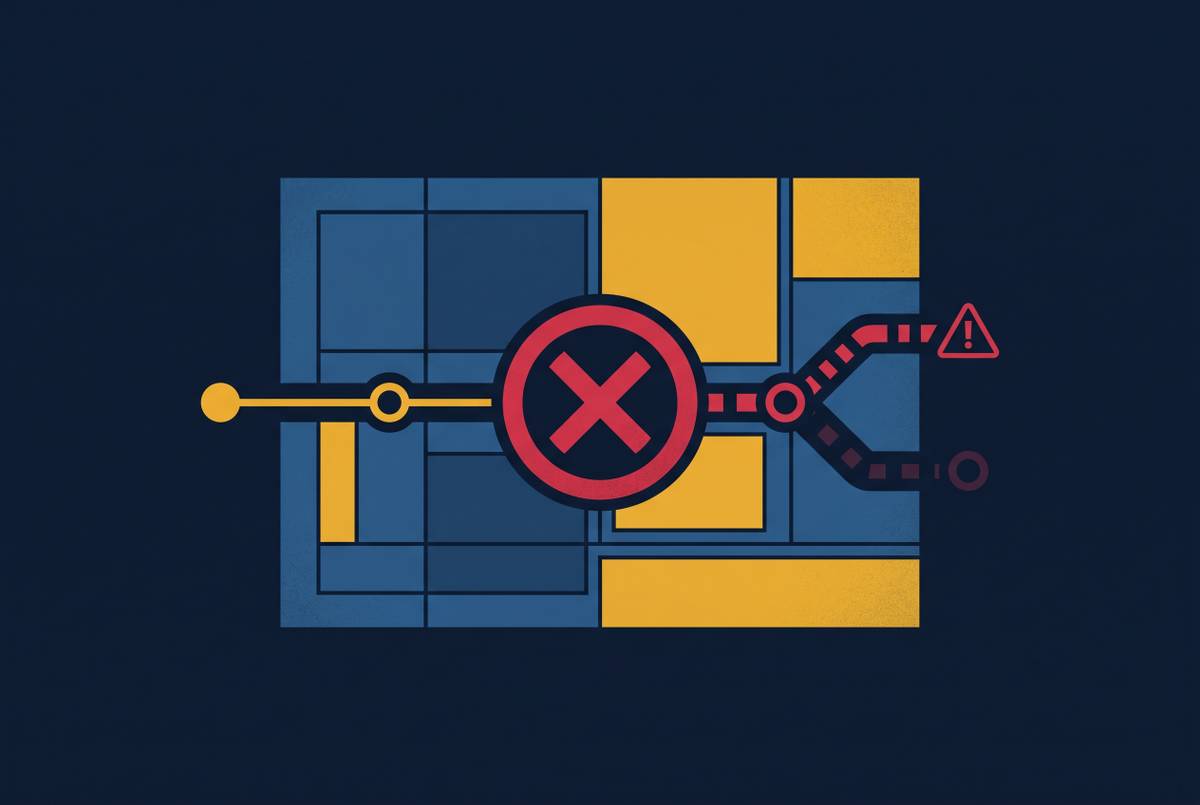
Conduit sharing is the most consequential gap. Two provider routes that look separate on a network map may share the same underground conduit. That shared stretch is a single point of failure, which a distance layer cannot show without information from the carriers. Teams must therefore record provider diversity and physical route diversity as separate findings.
Highway and rail proxies overstate access where fiber follows different geography, so their scores should be treated as directional. Conversely, terrestrial maps in emerging markets may not reflect recent undersea cable landings, including 2Africa, Equiano, and Bifrost, and may undervalue coastal cities whose connectivity has changed. The GIS screen ranks candidates, and physical route verification with carriers confirms diversity before capital commitment.
What happens when fiber scoring is applied too late or weighted incorrectly in a project
Late fiber scoring allows a project to advance before the cost of its connectivity gap is understood. A selected site may need costly fiber extensions or infrastructure upgrades that an early screen could have exposed. The consequences include delays, inflated budgets, and long-term operational inefficiencies.
A workload mismatch creates a different failure. A latency-sensitive colocation facility on a campus assessed for AI training may have a good enough distance score but fall short on route diversity or IXP proximity. In that case, the scoring method has answered the wrong question correctly. Late scoring also has a competitive cost, because sites with strong connectivity can be secured before a slower diligence process identifies their value.
The consequences of incomplete infrastructure diligence are also becoming more formal. ERCOT issued an RFI in September 2026 following direction from the Governor of Texas to obtain information about data center impacts on the grid. Responses were due October 12, 2026, with a published report targeted by December 10, 2026. The request calls for water, cooling, grid dependency, and community impact data in a structured form for use by regulators. Those stated inputs show why weak infrastructure records have implications beyond the project itself.
How to integrate fiber proximity scoring correctly into a multi-factor site evaluation
The process starts with the workload and has two stages, an early GIS score and physical checks with carriers. Set the fiber weight from the intended use rather than carrying a standard weighting into every project. Apply the power filter first, then assess connectivity thresholds and rank the surviving parcels. Fiber belongs in the first spatial screen, even though a favorable fiber result cannot override failed power.
In that first stage, score distance, route diversity, capacity, and latency separately before combining them with power, hazards, zoning, and land. Use multiple sources, including provider network maps, and identify any highway or rail proxies as approximations. Give latency-sensitive colocation more fiber weight and AI training less. Use the resulting ranking to narrow the field.
In the second stage, confirm route independence at the conduit level with carriers and test IXP access against the workload’s latency budget. If routes share a conduit, reduce the effective fiber score to reflect the lost diversity. Bring those findings into design so that the connectivity assumptions reach beyond a separate site-selection file. Otherwise, the separation of fiber, power, and layout data creates manual rework when detailed engineering begins.
ArchiLabs Studio connects layout, cable routing, and engineering data within a single workflow, giving that traceability a place in detailed design and operations handoff. Its role here is to carry the connectivity logic forward. The final record should show how the GIS query, workload weights, and physical verification contributed to the decision. Downstream teams need to inherit the reason the site works.