Bottom-Up vs. Top-Down Capacity Forecasting Methods for Data Centers
Regional power constraints invisible to national forecasts can derail data center projects.
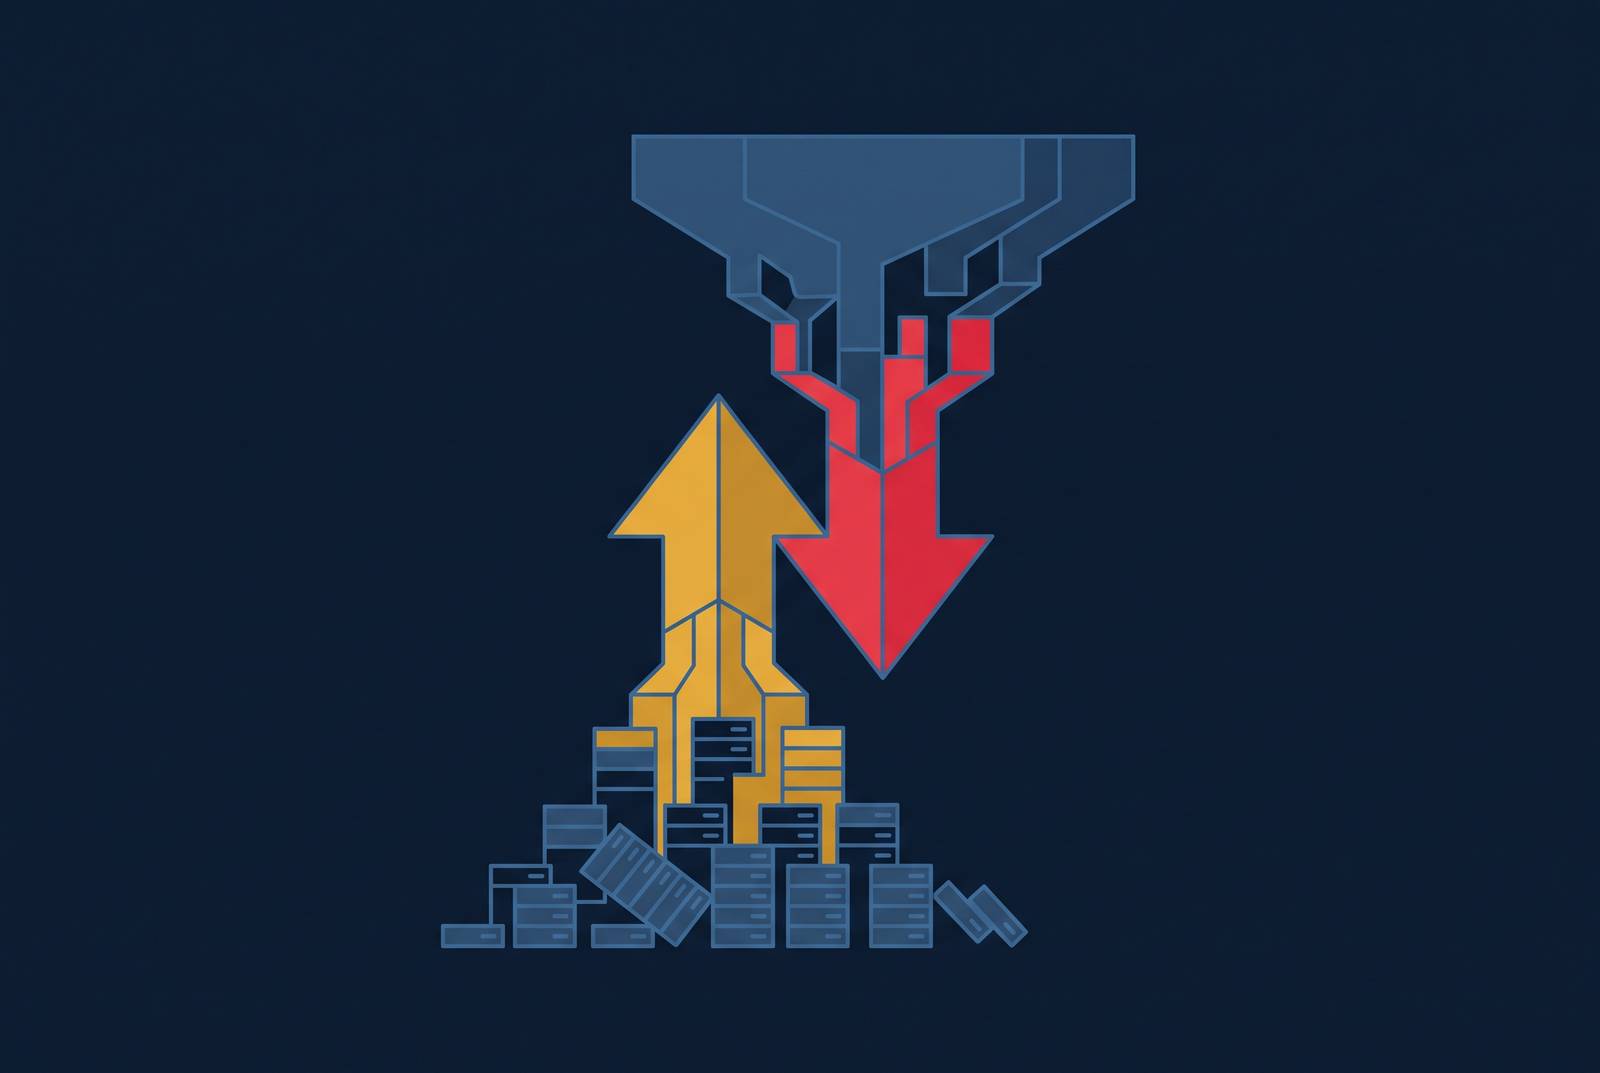
A growing share of announced data center capacity never comes online on schedule, and that gap is now wide enough that it can decide whether a project's financial case holds together. Goldman Sachs Commodities Research projects US data center power demand will more than double, climbing to 66 GW in 2027 from 31 GW in 2025. You build that number from aggregate demand signals, like economic trends and adoption curves. But the same research finds only roughly half to three-fifths of capacity scheduled for the next one to two years is expected to come online on time, once delays and cancellations are counted. A finding like that only comes from checking projects one by one, not from scaling up a national total.
The regional picture makes the split even sharper. Mid-Atlantic, Mid-Continent, and Northwest markets face elevated reliability risk, but Texas and Georgia may barely feel it. No system-wide forecast can see that kind of difference; it lives below the level where national totals are built. Top-down and bottom-up forecasting are not two paths to the same answer. They answer different questions, and a planning team's first job is figuring out which question it's actually asking before picking a method to answer it.
Top-down Forecasting
Top-down forecasting starts with the whole system and works down. It takes aggregated demand, historical trends, GDP and broader economic activity, electrification targets, policy assumptions, and technology adoption curves, and turns them into one coherent demand outlook. Its strength is consistency: a single control total that keeps every region, zone, and customer class adding up to the same system-wide number.
That makes it the right tool for certain decisions and the wrong tool for others. Utilities turn to it for resource adequacy studies and long-term transmission planning. Developers use it for regional energy outlooks. In data center planning specifically, top-down answers portfolio-level questions: how many total megawatts a hyperscaler commits to across a region, how a developer splits capital across markets, how a utility plans grid reinforcement for a cluster of expected projects.
A top-down number can be pushed down to load zones, transmission nodes, or customer classes, but that step is an allocation, not a measurement. It spreads an existing total across smaller pieces rather than building a new total from what's actually happening on the ground. It works fast because the data it needs already sits in macroeconomic reports and historical records, so no site-level detail is needed. That speed and consistency are why organizations reach for it first when setting portfolio targets or capital plans.
Where top-down forecasting breaks down for data center planning
Top-down forecasting allocates demand instead of observing it, and that is its biggest weakness in data center planning. A single campus can now draw more than 300 MW. When a method spreads regional growth evenly across nodes and substations, errors at that scale become blind spots that hit entire projects.
A modest bump in regional demand doesn't mean every node and substation in that region grows by the same share, but a top-down allocation treats the whole area as though it does. Goldman Sachs Research shows how far that assumption can miss: regional reliability risk diverges sharply, with Mid-Atlantic, Mid-Continent, and Northwest markets facing elevated risk while other regions see comparatively little. A system-wide adequacy number can look solid, but it can hide the exact local constraint that governs when a project can actually deliver power.
The delivery gap itself proves the point. Aggregate forecasts treated the announced project pipeline as a reliable demand signal. Project-by-project tracking tells a different story: a sizable share of that pipeline shows no visible construction progress despite typical build timelines. The national number looked fine. The ground truth didn't match it.
For design and engineering teams, this has real teeth. A schedule built on a top-down number, without checking power interconnection status, equipment procurement windows, or grid connection timelines at the project level, will routinely state the wrong readiness date. If teams lock in long-lead equipment on a timeline that isn't real, that decision is hard to reverse once made. None of this makes top-down forecasting wrong. It's answering a portfolio-level question well. Project teams need an answer to a different question, and that's where bottom-up forecasting comes in.
Bottom-up Forecasting Starts with the Rack
Bottom-up forecasting runs the opposite direction: it builds the capacity picture from individual loads and physical constraints upward, until a credible megawatt figure emerges at the hall or campus level. In data center planning, that process starts with the rack, not the region. Before anyone can state a confident MW number for a facility, someone has to work through rack density targets, cooling topology, and power distribution architecture.
These inputs look nothing like the macroeconomic proxies that feed a top-down model. Bottom-up draws on rack-level power density targets, cooling system type and capacity, UPS and switchgear topology, fiber and cable routing, and known equipment specifications. These are physical, project-specific numbers, not regional averages.
Rack density itself has shifted hard because AI workloads are moving into production. Facilities built for high-density AI compute now carry loads far above what used to count as standard. That shift has flipped the design process: thermal and power topology now come first and set the terms for the layout.
Cooling choice and the MW forecast can't be separated. Air-based cooling supports one range of rack density. Liquid cooling supports a much higher range, and you need it for the highest-density AI and HPC workloads running today. Each cooling approach brings its own mechanical, controls, and IT vendor coordination requirements, and each one affects the project timeline in its own way.
Bottom-up forecasting also forces a team to confront lead-time dependencies that never appear in a macro model: fiber and cable procurement, Battery Energy Storage System design and structural loading, liquid cooling commissioning. Any one of these can delay an energization date even when the regional power picture looks fine. That's why bottom-up is the right tool for distribution planning, large-load connection assessment, data center and industrial cluster analysis, EV charging infrastructure, and any decision that depends on exactly where demand lands, not just how much shows up somewhere in the region.
Where bottom-up forecasting overstates demand
Bottom-up forecasting carries its own failure mode, which appears the moment a team treats every requested or proposed load as a load that will actually materialize. The sum of every announced project in a pipeline is not the same as the amount of demand that arrives on schedule. Project realization rates, customer diversity, and load coincidence all have to be applied on purpose. They don't apply themselves.
In data center planning, the announced pipeline is consistently larger than the pipeline of projects with active construction progress. If a bottom-up forecast counts every announcement as a confirmed load without discounting for delivery risk, it will overstate near-term demand. Goldman Sachs Research puts a number on that risk: about 60% of capacity scheduled for the next year is expected to come online on time. That's a realization-rate haircut a bottom-up model has to apply on purpose, project by project, checking power interconnection status, equipment procurement, and construction readiness for each one.
Skipping that discipline means the consequences land on the design team. Infrastructure gets over-provisioned. Equipment gets locked in before it should be. Ownership hears readiness timelines that don't hold up. Each of those mistakes carries a real cost.
Bottom-up forecasting also demands a level of data quality many organizations can't currently supply: rack-level load profiles, confirmed equipment specifications, accurate as-planned schedules. When that input data is stale, kept up by hand, or scattered across systems that don't talk to each other, the forecast absorbs those errors without flagging them. The fragmentation that creates this blind spot runs deeper than analytics. It comes from capacity data that people rebuild by hand across portfolio planning tools, DCIM systems, and project-delivery workflows, and each one holds its own version of the same facts. Design automation platforms like Archil Labs, which connect layout data, equipment specifications, and structured operations handoff into one workflow, let project-level capacity assumptions feed directly into forecasting models, closing the distance between what aggregate forecasts predict and what site-level reality shows. Bottom-up's accuracy ceiling is set by the data it consumes. When that data is weak, the forecasting problem is really a data problem wearing a forecasting problem's clothes.
Why combining both methods requires reconciliation, not just addition
Running top-down and bottom-up forecasts side by side only helps planning when someone actively reconciles the two against each other. The gaps between them carry information. They are not noise to be averaged away.
Integrated planning needs both. System-wide adequacy studies and strategic outlooks need a top-down framework. Local network and connection decisions need bottom-up evidence, the kind you draw from actual projects. Neither one covers what the other is built for.
When the two forecasts land close together, the planning basis gets stronger. When they diverge, that divergence points straight at the weak assumption: either the macro model missed a local concentration of demand, or the bottom-up model is counting unconfirmed loads without discounting for realization risk. Effective blended modeling pairs top-down demand forecasting, driven by portfolio targets and market scenarios, with bottom-up infrastructure modeling that maps megawatts per hall, coolant flow rates, and logistics constraints. Sensitivity analysis then gets applied to the variables that actually decide when a project can deploy: grid connection timelines, transformer procurement windows, equipment delivery schedules.
Reconciliation forces explicit choices. Someone has to decide which bottom-up projects count as confirmed, which stay probabilistic, and how that probability feeds into the top-down control total. For design and engineering teams, this is the point where a hall-level design decision connects to a portfolio-level capital commitment, where a rack move or a density upgrade or a cooling system change ripples straight into the forecast. One reason top-down forecasts treat an announced pipeline as a credible demand signal, without catching construction delays, is that the data linking design intent to actual delivery progress sits in disconnected systems: layout files, RFIs, equipment specs, and schedule updates scattered across email, spreadsheets, and tools that don't share information. A connected project workflow that traces equipment parameters, cable routing, and power assumptions from design through to operations handoff can show forecasters which announced projects have real engineering backing behind them and which are still just names on a list. A team that skips formal reconciliation ends up doing it anyway, through scope changes, RFIs, and schedule slippage, at a far higher cost than it would have paid doing the work up front.
Structured, connected data as the prerequisite for running both methods reliably
Neither method works well on its own terms unless the data underneath it is current and connected. Bottom-up forecasting needs current rack-level load data, confirmed equipment specifications, as-planned power and cooling topology, and accurate lead-time schedules. In most project environments, those live in separate spreadsheets, PDFs, and tool-specific models that were never built to sync with each other.
Top-down forecasting needs consistent portfolio targets and historical demand baselines, and those are only as good as the project-level data feeding them. When individual project data is stale or missing pieces, the aggregate number inherits that same error, just at a bigger scale.
The handoff from BIM to operations is where this fragmentation costs the most. Capacity data locked inside design models that never connect to DCIM, EPMS, or BMS means the operations team ends up forecasting from a different baseline than the one the design team used. Reconciling the two takes manual work, costs real money, and rarely gets finished all the way. Equipment data trapped inside manufacturer PDFs, rather than flowing into models and validation rules, means rack-level load assumptions in a bottom-up model may not match the equipment actually being procured. That mismatch introduces systematic errors that grow as the project scales up.
Bottom-up accuracy depends entirely on the quality and currency of the rack-level data behind it, and that data often sits across multiple tools with no single source of truth for equipment specs, power draw assumptions, or cooling requirements. Platforms that automate the connection between design models, equipment intelligence, and DCIM ingestion can make sure every rack-level assumption in a bottom-up forecast traces back to the data supporting it, and that a change to layout, equipment, or power strategy cascades through the forecast automatically instead of waiting for someone to reconcile it by hand. A single rack move in a disconnected environment turns into manual rework across power schedules, cooling calculations, cable routing, and documentation. The forecast and the design keep drifting apart, and fixing that drift means starting over.