PUE Benchmarking Across Hyperscale and Enterprise Data Center Designs
Hyperscale operators achieve 1.09 PUE while enterprises plateau at 1.54.
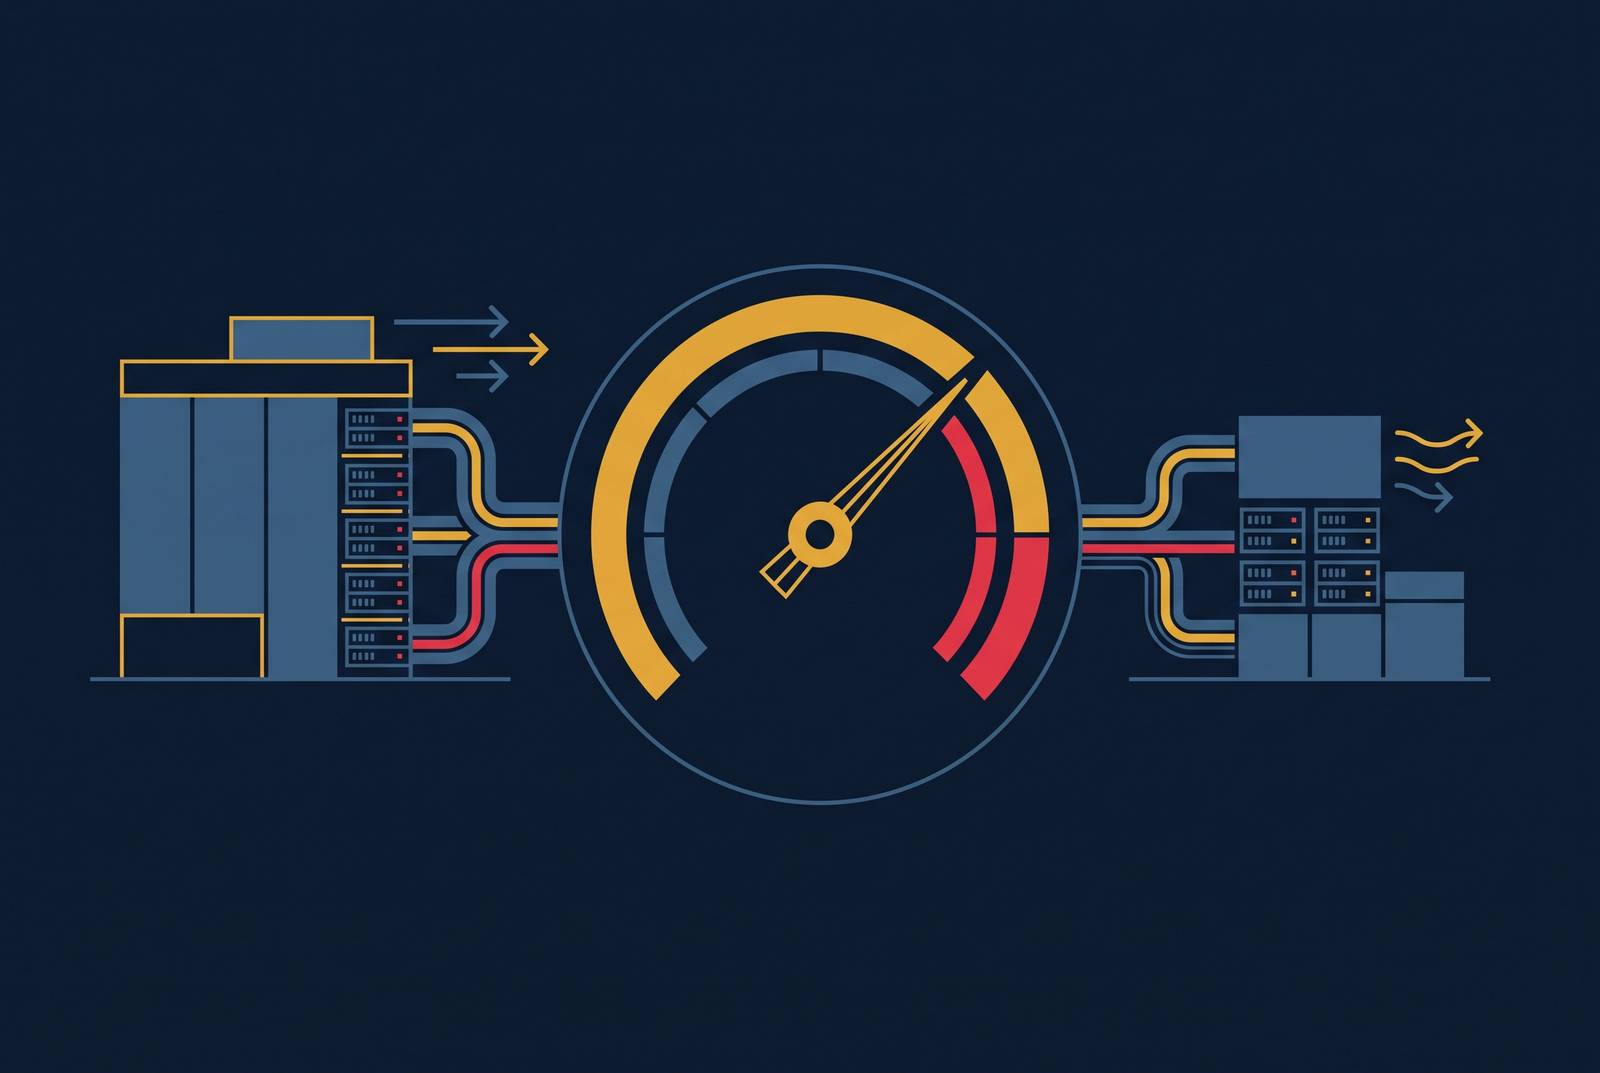
Power usage effectiveness is a ratio: total facility power divided by IT equipment power. The Green Grid developed the formula in 2007, and it has stayed the industry's basic yardstick ever since. A perfect score is 1.0: every watt entering the building goes straight to computing, with nothing lost along the way. No facility hits that number in practice, because cooling, UPS systems, transformers, and power distribution all draw energy just to keep the IT load running. Overhead is built into the physics of the building.
The metric earns its place for a few clear reasons. It gives operators one trackable number for infrastructure overhead, a single figure to watch move over months and years. It points to where energy disappears, whether in cooling, power conversion, lighting, or distribution losses. And it has become the anchor for data center energy reporting across regulatory frameworks, most consequentially under the EU Energy Efficiency Directive, where it shapes what operators must disclose.
But PUE stops short of telling the full story. It says nothing about carbon. A facility can post a best-in-class PUE and still generate heavy emissions, because the ratio measures overhead, not what's behind the power source feeding it. PUE answers one question only: how much energy does it take to run the IT equipment, on top of the IT equipment itself?
Used well, PUE tracks a facility's performance over time, flags cooling systems that are oversized or underused, and proves out the payoff of upgrades like hot/cold aisle containment. It also satisfies the marketing and compliance boxes operators increasingly need to check. All of that makes it a genuinely useful number. None of it means the number can be compared across operators without first asking how, and where, it was measured.
Inconsistent measurement and reporting across the industry
Before the gap between hyperscale and enterprise PUE means anything, the number itself needs context, because the same figure can describe very different things depending on how it was measured. Fleet-wide PUE, campus quarterly PUE, campus trailing-twelve-month PUE, regional averages, and age-banded averages are five distinct measurements, and they can diverge by several tenths of a point for the exact same operator, depending on which one gets reported.
Google reports a trailing twelve-month, or TTM, PUE across its large-scale data centers, but only once each one reaches stable operations. That figure comes from continuous measurement across the entire worldwide fleet, through every season, counting every source of overhead. That's an unusually strict way to define measurement scope, and it matters because a lot of publicly reported PUE figures don't work that hard to be comparable.
A single vendor-wide average can bury a large gap between an aging hall and one just brought online. A campus with one legacy building and one newly commissioned building might report a blended number that looks respectable, while hiding a facility running well above it and another running well below. Anyone running procurement, carbon reporting, or ESG scoring tied to energy intensity should ask for the site-level PUE, not the portfolio average, along with the age or commissioning year of the specific hall in question.
Self-reported figures from a single operator show what's achievable with purpose-built infrastructure and real capital behind it. They don't set a bar every enterprise facility can expect to clear without matching that investment. The scope of what's being measured isn't a technicality. When one operator reports a full facility-level TTM figure and another reports a quarterly campus number taken at partial load, lining the two up side by side produces a conclusion that doesn't hold up.
Industry status: a plateaued market against a hyperscale frontier
The industry's average PUE has mostly stopped improving, but a small group of hyperscale operators has pushed well past levels once thought out of reach. That reflects a different cost and carbon profile for delivering the same amount of IT work between two facilities doing similar work.
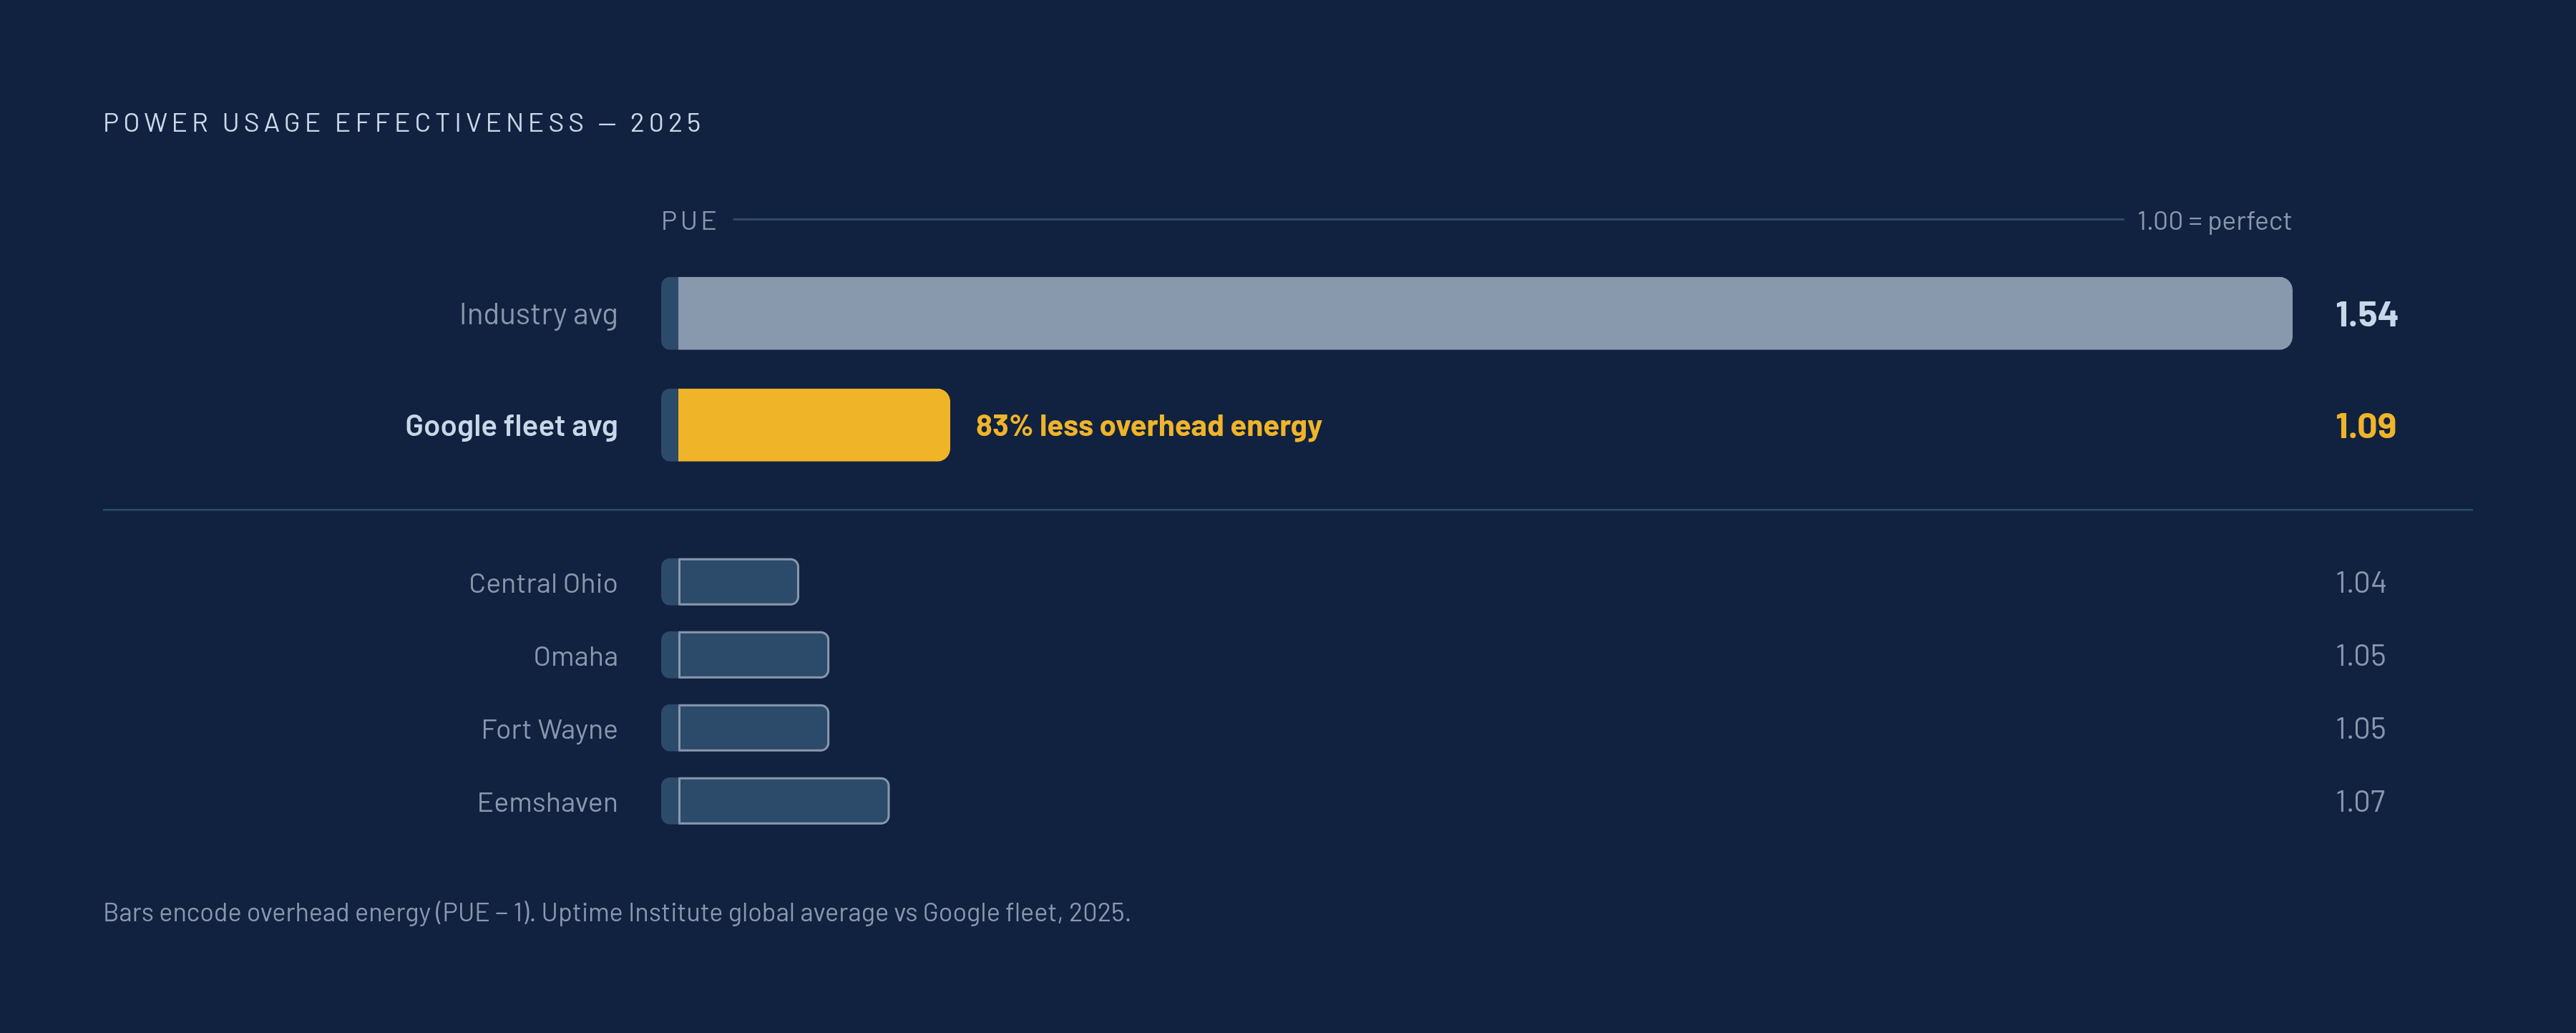
Two distinct periods define the metric's history: rapid gains from 2007 to 2014, when industry-wide adoption of best practices drove quick improvement, followed by a plateau that has held since 2014. The Uptime Institute's 2025 Global Data Center Survey put the global average PUE of respondent facilities at 1.54. That's roughly where the industry has sat for over a decade.
Google's 2025 fleet-wide average PUE was 1.09, and it comes from continuous measurement across all its large-scale data centers worldwide, through every season, counting every source of overhead. The campus-level figures tell the same story at the site level: Central Ohio (Lancaster), Ohio came in at 1.04 TTM; Omaha, Nebraska at 1.05 TTM; Fort Wayne, Indiana at 1.05 on a quarterly basis; and Eemshaven, Netherlands at 1.07 TTM. Sub-1.10 performance appears across multiple sites, so no one standout facility carries the average.
The distance between a 1.54 industry average and a 1.09 fleet figure represents a large difference in overhead energy spent per unit of IT work. Google uses 83% less overhead energy than the industry average. The 2026 data repeats the same pattern: a small set of hyperscale operators keeps pushing PUE to levels unthinkable a decade ago, while the broader market holds roughly where it was in 2014. The plateau at 1.54 means the lessons hyperscale has spent a decade proving out have not spread broadly across the enterprise market.
Geography and climate explain only part of the hyperscale advantage
Climate helps, but it doesn't explain the whole gap. Cooler ambient temperatures cut the mechanical cooling load a facility needs to carry, which is a real efficiency gain, and it's why operators have long gravitated toward places like Scandinavia and the Pacific Northwest when siting new builds.
Google's fleet-level TTM of 1.09 holds up across sites with very different climates, including Singapore at 1.12 to 1.15 TTM, Quilicura, Chile at 1.08, and Henderson, Nevada at 1.09. Singapore runs hot and humid year-round. Henderson sits in the Nevada desert. Neither location offers the free cooling advantage of a site in Scandinavia, yet both land close to the fleet average.
Regional averages give a reasonable proxy for the overhead a facility is likely to carry, but they're no substitute for a site-specific number. The gap between facility classes within a single region runs larger than the gap between the regional averages themselves. Enterprise facilities that still run older infrastructure in temperate climates post PUE figures at or above the 1.54 global average, so climate alone doesn't close the distance. The stronger explanation sits in design choices, infrastructure vintage, and the operational systems built into a facility from the start.
The design decisions that separate a 1.09 from a 1.54 facility
The gap between a 1.09 facility and a 1.54 facility traces back to decisions made at the design table, long before a single server gets racked. Cooling architecture sets the ceiling first. Free cooling, economizers, and direct liquid cooling all cut the mechanical cooling load that dominates overhead at high-PUE facilities. Air-cooled buildings in warm climates running on older mechanical plant carry the heaviest overhead of any facility class, because mechanical cooling has to do work that a well-designed facility avoids by using outside air or liquid cooling loops instead.
Hot/cold aisle containment demonstrates this directly: operators who add containment to an existing facility see a measurable drop in PUE, proof that the upgrade is a design decision with a real, countable impact rather than a maintenance tweak.
Power density has shifted the ground under every design assumption that came before it. Traditional data centers run at 5 to 10 kW per rack. AI-optimized facilities now need 60 kW per rack or more. A facility designed around low-density assumptions can't reach the same overhead ratio as a hall built from the start for high-density loads, no matter how well it's operated, because the cooling and power infrastructure simply wasn't sized for that kind of load.
Redundancy configuration adds another layer. A 2N configuration doubles every electrical and mechanical system across two fully independent sets of infrastructure: separate utility feeds, separate switchgear lineups, separate UPS systems, separate distribution paths, each one sized to carry the full load on its own. That redundancy buys resilience. It adds overhead that does nothing to improve PUE, because idle backup capacity still draws power even when it's not doing useful work.
Infrastructure vintage compounds all of it. Hyperscale operators have built a larger base of recently constructed, purpose-designed halls, which gives them a structural head start enterprise facilities can't match without real capital reinvestment in aging plant. Power conversion adds a final layer of loss: transformers, UPS systems, and distribution equipment all consume energy that raises PUE overhead directly. Modern transformers and double-conversion UPS systems running at high load factors can cut those losses, but only where you've installed them.
None of these decisions acts alone. A facility running older mechanical plant, low-density legacy racks, 2N redundancy, and no aisle containment posts a high PUE no matter what climate it sits in. That outcome was designed in at the blueprint stage, not created later through how the facility gets operated day to day.
How AI workloads are reshaping the PUE calculus
High-density AI workloads don't just raise power draw. They change what a well-designed data center has to look like, and that shift rewards facilities built for purpose while exposing the ones that weren't.
AI and ML processing draws 600 watts or more per server and generates a cooling load share of 50 to 55%, well above the share generated by workloads like video streaming or online gaming. That makes cooling system design even more central to the PUE outcome than it already was. At 60 kW per rack and higher, the cooling pathway has to be purpose-built from the start. Retrofitting adequate cooling into a legacy hall designed for 5 to 10 kW per rack is a capital project and a design problem, not something a facilities team can fix through better operations.
Google's data centers delivered more than three times the compute performance per unit of energy in 2025 than they did five years earlier, and TPU energy efficiency improvements drove most of that gain. That result shows the IT equipment power side of the ratio can improve faster than the overhead side, when purpose-built silicon gets deployed at the scale hyperscale operators can manage.
Enterprise facilities face a different version of the same pressure. AI workloads tend to arrive as a demand spike into infrastructure that was never built to absorb them. The impact on PUE runs asymmetric: dropping high-density AI racks into a legacy hall raises the facility's overall overhead ratio, even when the new racks themselves are efficiently cooled on their own, because the rest of the building's infrastructure wasn't sized for that kind of load.
AI is changing the operational layer too. Machine-learning algorithms are already tuning airflow, pump speeds, and power distribution in real time inside modern facilities. Those tools depend on instrumentation and controls infrastructure that legacy enterprise facilities often don't have in place. Put together, these shifts mean PUE is moving from a comprehensive gold-standard metric toward a narrower, infrastructure-only measure, and performance-per-watt for AI workloads is becoming its own separate and increasingly important efficiency dimension.
MEP coordination, cable routing, and whether a design's PUE ambition survives construction
A design that targets 1.15 PUE on paper can be 1.4 once it's actually built, if mechanical, electrical, and plumbing coordination breaks down during construction. Clash-driven field changes, cooling paths that get rerouted mid-build, and cable congestion that blocks airflow aren't side issues. They feed directly into the final efficiency number.
Mechanical ducts, electrical conduits, plumbing pipes, and fire protection systems all compete for the same ceiling space, risers, shafts, and service corridors. When these systems get designed independently of one another, field conflicts occur during construction, and resolving them forces compromises in the cooling path that never appear in the original design documents.
In a data center, a clash costs more than it would in an ordinary commercial building, because thermal consequences compound electrical rework. A chilled water line rerouted around a conduit clash gets longer, and a longer path adds delta-T that the mechanical system has to overcome every day the facility operates, not just once during installation.
Cable routing adds its own direct drag on the ratio. Poor cable pathways obstruct the airflow the cooling system depends on, forcing that system to work harder to hold the same temperature. A facility can be designed by engineers who understood every lesson in the sections above, with containment, right-sized redundancy, and modern power conversion equipment specified correctly. None of that design intent survives automatically. It survives only if MEP coordination holds together from blueprint through final cable pull, because that's the stage where a 1.09 design decision either gets built as drawn or quietly becomes something closer to 1.54.
Sources
- Power usage effectiveness
- Understanding the power consumption of data centers
- Large data centers are mostly more efficient, analysis confirms - Uptime Institute Blog
- PUE™: A COMPREHENSIVE EXAMINATION OF THE METRIC
- Is this the data center metric for the 2030s? - Uptime Institute Blog
- Assessing the Carbon Emissions and Energy Consumption of U.S. Hyperscale Data Centers
- The Fallacy of Sustainable Generative AI: Limitations in EU Environmental Regulation of Data Centres and Paths Forward
- PUE in Data Centers: Definition, Formula & Energy Efficiency Explained - Attom Technology